Much has been said about Elixir debugging techniques, but in this post, I’d like to give a quick overview of all possible options to serve as a go-to reference when you need to debug Elixir code. Enough talking, let’s check each of them:
IO.inspect
The simplest technique:
my_list = [1, 2, 3]
IO.inspect(my_list)

# Outputs
[1, 2, 3]
IO.inspect/2 can also be used inside pipelines because it returns the item passed to be inspected. And the tip here is to use the option label: to output a string identifying each inspect:
[1, 2, 3]
|> IO.inspect(label: "before")
|> Enum.map(&(&1 * 2))
|> IO.inspect(label: "after")
|> Enum.sum

# Outputs
before: [1, 2, 3]
after: [2, 4, 6]
IO.inspect with binding
binding/1 is very useful when you want to see all variable names and values of the current function:
def some_fun(a, b, c) do
  IO.inspect binding()
  ...
end

iex> some_fun(:foo, "bar", :baz)
[a: :foo, b: "bar", c: :baz]
apex
Similar to IO.inspect/2, apex is a lib worth mentioning especially because of its adef macro:
# import apex adef macro
import Apex.AwesomeDef

# change def to adef
adef test(data, options \\ []) do
  data
end

# when you call your function, you'll receive detailed information about its execution
iex(1)> Apex.test "foo"
>>>>>>>>>>>>>>>>>>>>>>>>>>>>>>>>>>>>>>>>>>>>>>>>>>>>>>>>>>>>>>>>>>>>>>>>>>>>>>>>>>>>>>>>>>>>>>>>>>>>
Function Elixir.Apex.test was called
defined in /Users/bjoernrochel/Coding/Laboratory/apex/lib/apex.ex:12
----------------------------------------------------------------------------------------------------
Parameters:
----------------------------------------------------------------------------------------------------
[
  [0] "foo"
  [1] []
]

----------------------------------------------------------------------------------------------------
Result:
----------------------------------------------------------------------------------------------------
"foo"
IEx.pry
But it can be very tedious and limiting to debug with just data inspection like IO.inspect or apex, that’s when IEx.pry/0 comes at hand because it allows you to pry into the current code. Put the following code at the line you want to pry:
def some_fun(a, b, c) do
  require IEx; IEx.pry
  ...
end
And now execute your code inside an IEx session: iex -S mix or iex -S mix phx.server if you are using Phoenix Framework. Tip: if you are running tasks like database seeds, you can pry into that code by running iex -S mix run priv/repo/seeds.exs or any other script.
Once the code execution gets to the point of IEx.pry, an interactive shell opens and allow you to interact with the current code.
Go to Debugging Phoenix with IEx.pry if you want more tips about debugging Phoenix with IEx.pry.
:debugger
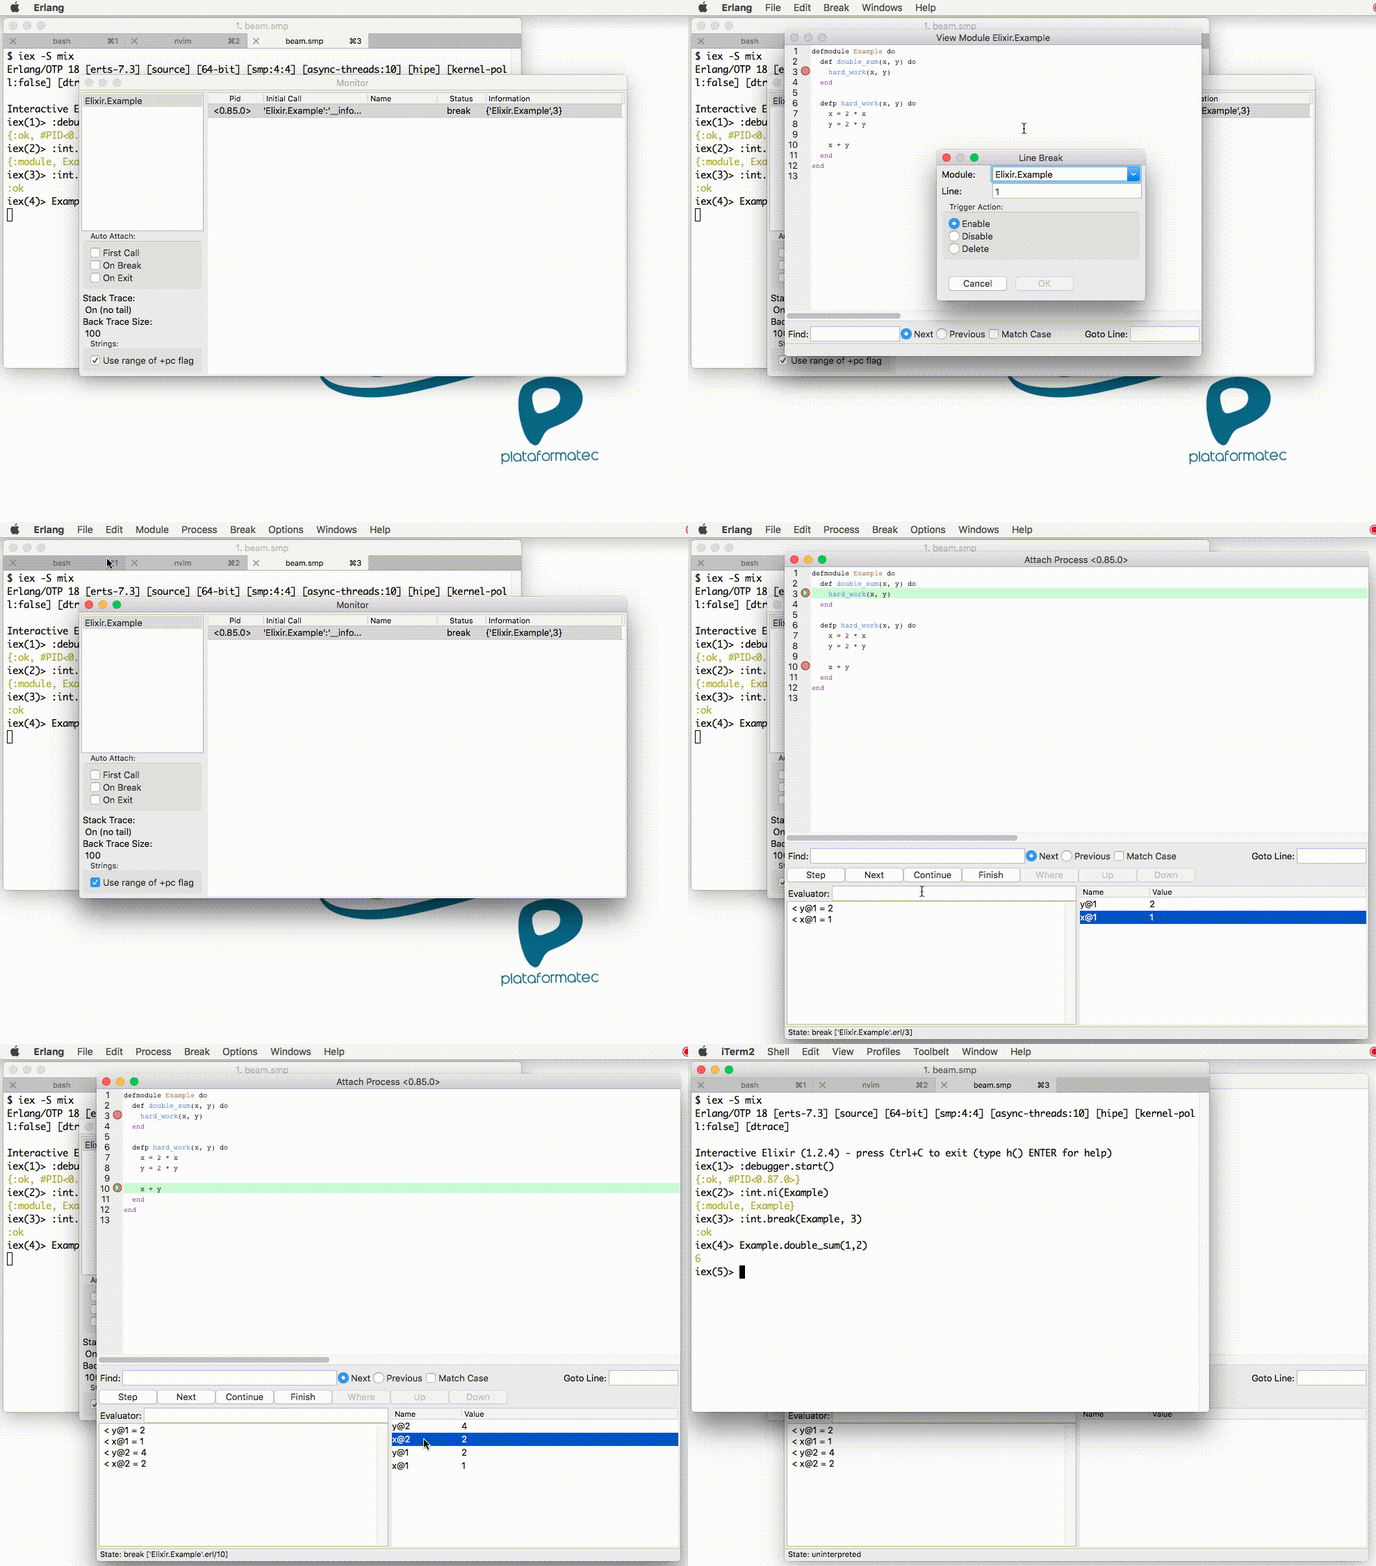
Pretty much the same as IEx.pry which stops the execution at the break point and allows you to inspect the current code, but :debugger gives you a nice visual interface, like the ones in IDEs:

gif from http://blog.plataformatec.com.br/2016/04/debugging-techniques-in-elixir-lang
To open this debugger, you need to start it and set a break point:
# given that you have this module
defmodule MyApp.Example do
  def sum(x, y) do
    x + y
  end
end

# start a new iex session
$ iex -S mix

# then start :debugger
iex> :debugger.start()

# prepare your module for debugging
iex> :int.ni(MyApp.Example)

# set a break point at the line you want to capture
iex> :int.break(MyApp.Example, 3)

# and finally call your function
iex> MyApp.Example.sum(1,2)
:sys.get_state and :sys.get_status
This one works only for processes. As the name suggests, :sys.get_state/1 gets the current state of a process, and not only from a GenServer but also from any kind of process:
iex(1)> defmodule Example, do: use GenServer
iex(2)> {:ok, pid} = GenServer.start_link(Example, %{ping: "pong"})
iex(3)> :sys.get_state(pid)
%{ping: "pong"}
Snippet extracted from Looking at the state of processes in Elixir.
If you need more data than just the current state, just call :sys.get_status/1, which will return whole process information:
Snnipet extracted from Programming Elixir book.
Bonus: you can replace a process state at runtime using :sys.replace_state/2, which can be very handy to test some specific situation.
Process.info
You can also use Process.info/1 to get information about a specific process:
iex> defmodule Example, do: use GenServer
iex> {:ok, pid} = GenServer.start_link(Example, %{ping: "pong"})
iex> Process.info pid
[
  current_function: {:gen_server, :loop, 7},
  initial_call: {:proc_lib, :init_p, 5},
  status: :waiting,
  message_queue_len: 0,
  messages: [],
  links: [#PID<0.610.0>],
  dictionary: [
    "$initial_call": {Example, :init, 1},
    "$ancestors": [#PID<0.610.0>, #PID<0.70.0>]
  ],
  trap_exit: false,
  error_handler: :error_handler,
  priority: :normal,
  group_leader: #PID<0.60.0>,
  total_heap_size: 233,
  heap_size: 233,
  stack_size: 10,
  reductions: 27,
  garbage_collection: [
    max_heap_size: %{error_logger: true, kill: true, size: 0},
    min_bin_vheap_size: 46422,
    min_heap_size: 233,
    fullsweep_after: 65535,
    minor_gcs: 0
  ],
  suspending: []
]
:sys.trace
Still talking about process debug, another resource we have is :sys.trace/2 to trace process calls, which will display each call and state change of the calling process:
iex> :sys.trace pid, true
:ok
iex> GenServer.call(pid, :next_number)
*DBG* <0.69.0> got call next_number from <0.25.0>
*DBG* <0.69.0> sent 105 to <0.25.0>, new state 106
105
# Excerpt From: Dave Thomas. “Programming Elixir ≥ 1.6” iBooks.
Distillery commands
After you deploy your application as a package release, it may be very helpful to get information about it, specially if something is not working as expected. If you have deployed using Distillery, you’ll soon discover that mix does not work the same way as in your local machine, and that’s expected. But you can execute some commands on that release by calling bin/<app_name> <command>, the two more useful commands are: remote_console to start an IEx session on the running release and help to give you a list of all commands.
:observer
Although it’s not exactly a debug tool, it’s worth mentioning that :observer helps you get an overview of the running system. I’ll not dig into details because there are a lot of articles that already do that, so I’ll just leave here the function call to start the observer:
iex> :observer.start
Notes and sources
If you have more tips and techniques, please leave a comment so I can update this post and help spread more Elixir knowledge. :)
Some code snippets were extracted from the great official documentation or from the official getting started tutorial.
The book Programming Elixir was also used as source.
The Today I Learned from Hashrocket is also a great source of tips.